They lost weight, but almost one-third of it came from muscle*. The scale improved while valuable body tissue was sacrificed.
The study that explains why recomposition matters
All three groups lost about 20–22 lb. Look at what that weight was made of. Don't you want the third result?
They lost weight, but almost one-third of it came from muscle*. The scale improved while valuable body tissue was sacrificed.
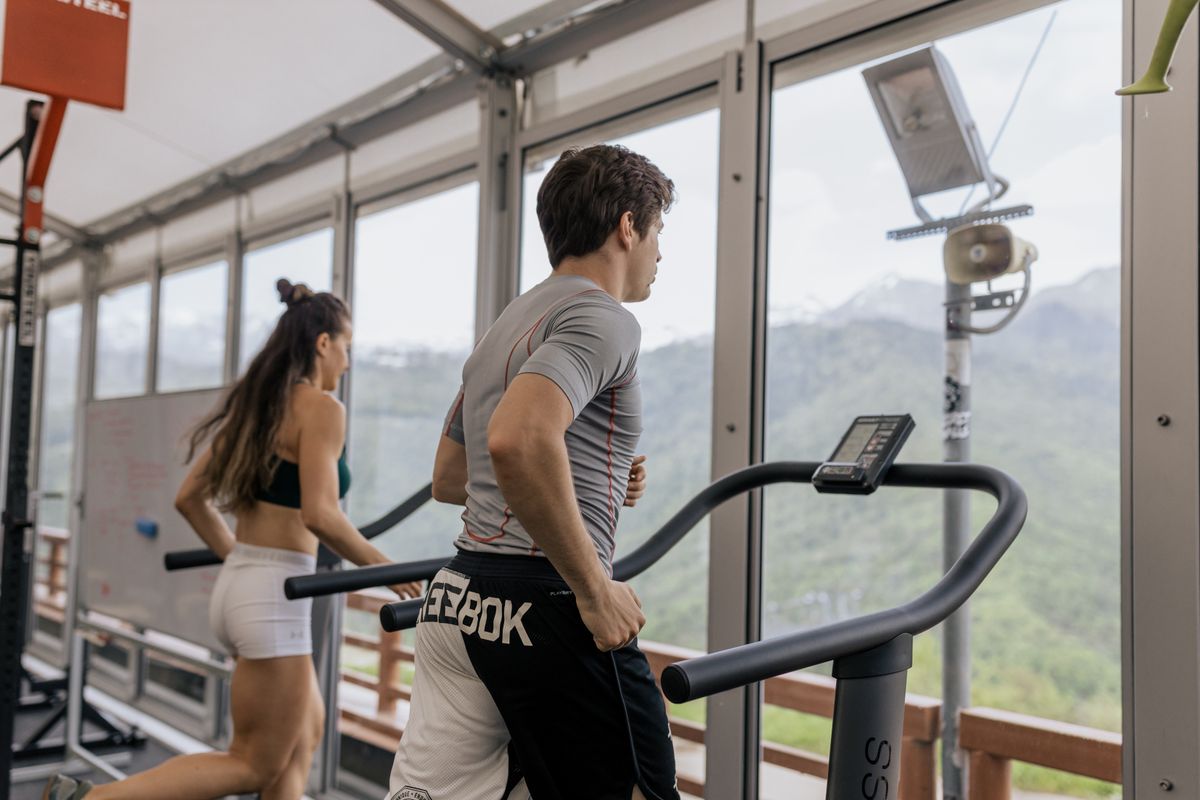
Cardio improved aerobic fitness and reduced muscle loss versus diet alone, but it still did not preserve muscle nearly as well as strength training.
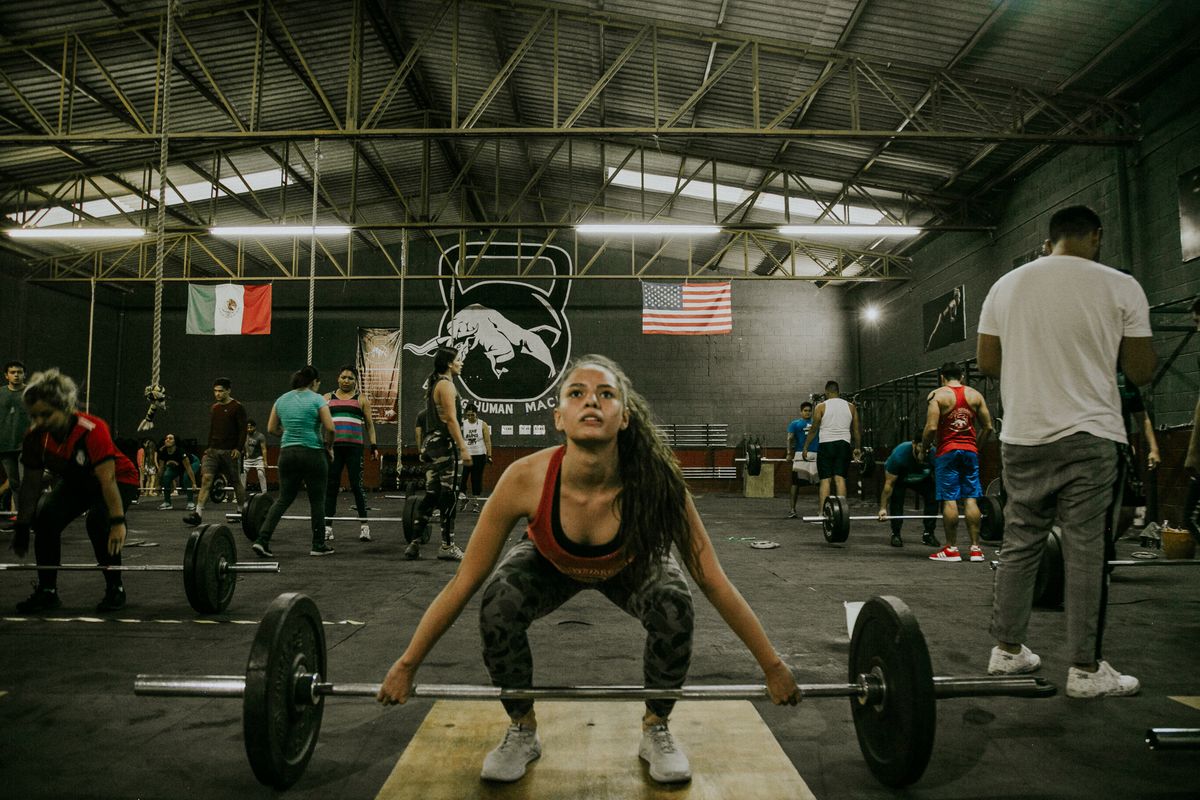
About 97% of the weight loss was fat—and strength increased. Same basic scale result. Dramatically better body-composition result.
THE CONCLUSION IN PLAIN ENGLISH
Most diets are judged by one number: how far the scale goes down. But the scale cannot tell you whether you lost fat, lean tissue, water, or some combination of all three. That distinction is the entire reason recomposition matters.
In one 12-week randomized trial, the diet-only group, the diet-plus-cardio group, and the diet-plus-cardio-plus-resistance group all lost almost the same amount of total body weight—roughly 20 to 22 pounds. If you looked only at the scale, you could easily call all three approaches equally successful.
They were not.
Diet alone: about 69% of the weight lost was fat. That means roughly 31% of the weight lost was fat-free tissue.
Diet plus aerobic exercise: about 78% of the weight lost was fat. Roughly 22% was fat-free tissue.
Diet plus aerobic exercise plus resistance training: about 97% of the weight lost was fat. Only about 3% was fat-free tissue.
Same basic scale result. Completely different tissue result. The resistance-training group directed almost all of its weight loss toward fat while protecting nearly all of its lean tissue.
And the resistance-training group did not merely preserve tissue. Strength improved substantially: bench press strength increased about 19.6% and squat strength about 32.6%. In other words, those subjects became lighter while becoming stronger.
That is why 12 Week Recomp does not define success as “lose as much weight as possible.” A smaller number on the scale is not automatically a healthier outcome if a large part of the loss came from the lean tissue that supports strength, mobility, glucose control, physical function, and long-term independence.
The goal is not simply to lose weight. The goal is to lose fat while protecting—or building—the body underneath it.
AND IT CAN GO EVEN FURTHER
High protein + intense resistance and interval training during a large calorie deficit
What happened: body fat dropped dramatically while lean body mass increased. The protocol was intentionally aggressive and is not a normal expected rate, but it demonstrates that fat loss and lean-mass gain can occur at the same time.
PubMed • PMID 26817506 ↗High-protein resistance training at maintenance calories or a moderate calorie deficit
What happened: both supervised groups gained fat-free mass while reducing fat. The moderate-deficit group lost more fat without preventing lean-mass gain.
PubMed • PMID 41940947 ↗Higher protein during a resistance-training program
What happened: already training-oriented women added fat-free mass while losing fat without a prescribed crash diet.
PubMed • PMID 29405780 ↗High-protein diet during resistance training
What happened: the scale barely moved, yet the body changed substantially—fat went down and fat-free mass went up. This is exactly why scale weight alone can miss recomposition.
PubMed • PMID 26500462 ↗This is the difference 12 Week Recomp is built around. Fat down. Lean tissue protected—or increased. Strength and fitness moving forward.
THE MOST DIRECT WEIGHT-LOSS EVIDENCE
Diet vs. diet + aerobic vs. diet + aerobic + resistance training
Composition was the difference: fat accounted for about 69%, 78%, and 97% of the weight lost, respectively. The combined aerobic + resistance group increased bench press strength 19.6% and squat strength 32.6%; peak VO₂ rose 15.4% in that group and 24.8% with aerobic training.
Why it matters: nearly identical scale loss can hide dramatically different tissue outcomes.
PubMed • PMID 10487375 ↗Aerobic vs. resistance vs. combined exercise during weight loss in adults 65+
Fat mass fell about 13.9 lb with aerobic, 16.1 lb with resistance, and 15.4 lb with combined training. Strength improved about 4%, 19%, and 18%; peak VO₂ improved about 18%, 8%, and 17%, respectively. Combined training produced the strongest overall functional improvement.
Why it matters: aerobic training excelled at aerobic fitness; resistance protected lean tissue and strength; combining them produced the broadest functional result.
PubMed • PMID 28514618 ↗500 kcal/day deficit with or without resistance training
Fat loss was similar (−9.0 vs. −10.4 lb), but fat-free mass decreased in the sedentary group and was statistically unchanged in the resistance-training group.
Why it matters: resistance training changed what was preserved during similar diet-induced weight loss.
PubMed • PMID 19247271 ↗Diet alone vs. diet + exercise including progressive resistance training
Fat loss was similar (−15.0 vs. −17.0 lb), while the exercise group lost about half as much fat-free mass and increased upper- and lower-body strength by 17–43%.
Why it matters: similar weight and fat loss did not mean similar preservation of muscle-related tissue or strength.
PubMed • PMID 18580399 ↗BODY-COMPOSITION EVIDENCE LEDGER
All three groups lost about 5.5 lb body weight. Diet alone lost 5.5 lb fat with no lean gain. Diet + RT + 0.68 g/lb protein lost 15.4 lb fat / gained 8.8 lb lean in the casein arm and lost 9.3 lb fat / gained 4.4 lb lean in the whey arm. Strength increased 59% and 29% in those two training arms.
Useful for the training + protein + deficit interaction; not evidence that one protein source is universally superior. Source ↗College volleyball players completing progressive full-body resistance training showed an overall time effect of roughly +6.0 lb lean mass and −4.6 lb fat mass across the training conditions.
A short, athletic-population example of simultaneous lean gain and fat reduction without a prescribed large dieting phase. Source ↗Slow loss averaged a 19% energy reduction over 8.5 weeks; fast loss used about a 30% reduction over 5.3 weeks. Both lost ~5.5% body weight. Fat mass fell 31% vs. 21%, while lean body mass increased 2.1% with slower loss and was essentially unchanged (−0.2%) with faster loss.
Supports the idea that a more moderate deficit can better coexist with training adaptation. Source ↗During supervised resistance training, the whey-isolate group reported +11.0 lb lean mass and −3.3 lb fat mass; the casein group reported +1.8 lb lean and +0.4 lb fat.
Small study (13 recreational bodybuilders); useful as a trained-population recomp example, not as a basis for assuming those magnitudes in general users. Source ↗The graded-whey group showed −2.2 lb fat mass and +6.5 lb DXA lean mass; the maltodextrin group also gained +5.2 lb DXA lean mass. After correcting lean-mass change for extracellular water, gains were +2.6 lb from pre to midpoint and only +0.6 lb from midpoint to post (not significant).
An important measurement caution: DXA “lean mass” can be influenced by fluid, especially during extreme-volume training. Source ↗Both groups completed a progressive high-intensity resistance program while receiving either a multi-ingredient supplement or isocaloric placebo. The study measured DXA body composition and maximal strength over only four weeks.
Reviewed as short-duration trained-population context. Because the PubMed abstract does not report the exact body-composition deltas, this page does not present unverified lean/fat change numbers. Source ↗At 60% of habitual energy intake, the ~0.45 g/lb protein group lost 6.6 lb total and 3.5 lb lean mass. The ~1.04 g/lb group lost 3.3 lb total and only 0.7 lb lean mass. Lean loss differed significantly (p=.006).
Shows why protein becomes especially important when energy restriction is aggressive. Source ↗With resistance training, the 1.13 g/lb protein group increased fat-free mass from 103.8 to 108.5 lb (+4.6 lb) and reduced fat mass from 31.1 to 28.7 lb (−2.4 lb). The 0.41 g/lb group gained +1.3 lb FFM; its fat change was not significant.
Recomp occurred in already training-oriented women without a prescribed large calorie deficit. Source ↗The high-protein group averaged 1.54 g/lb/day, lost 3.7 lb fat, and gained 3.3 lb FFM while body weight changed only −0.2 lb. The normal-protein group gained the same 3.3 lb FFM but lost only 0.7 lb fat and gained 2.9 lb body weight.
A useful demonstration of why body weight alone can miss meaningful recomposition. Source ↗Both groups lost similar fat: −6.2 lb with two consecutive higher-carbohydrate refeed days and −5.1 lb with continuous restriction. FFM fell only −0.9 lb in the refeed group versus −2.9 lb with continuous restriction; dry FFM and resting metabolic rate were also better maintained.
Supports periodized energy/carbohydrate intake as one possible strategy for preserving training adaptation during a deficit. Source ↗Both high-resistance circuit and traditional strength training increased lean mass and 1RM strength. Only the high-resistance circuit group showed a significant reduction in body-fat percentage; the circuit sessions used much shorter inter-set recovery.
The published abstract does not provide exact weight changes, so the evidence is presented at the level the source supports. Source ↗With four training days per week, the whey group gained +3.1 lb lean mass and lost −2.2 lb fat. The maltodextrin group gained +0.9 lb lean (trend) and lost −1.1 lb fat (not significant). Bench-press 1RM increased +10.8 vs. +5.1 lb.
Another trained-female example of lean gain occurring alongside fat reduction. Source ↗Diet + exercise improved Physical Performance Test score 21% versus 12% with diet and 15% with exercise alone. Peak VO₂ improved 17% versus 10% and 8%. Diet and diet + exercise reduced body weight about 10% and 9%; lean mass fell 5% with diet but only 3% with diet + exercise.
Weight loss plus exercise improved function more broadly while attenuating lean-mass loss. Source ↗In the inactive bed-rest control, DXA lean mass fell from 125.4 to 116.8 lb (−8.6 lb) while fat mass was essentially unchanged (37.3 to 37.5 lb). A brief high-intensity jump-training countermeasure substantially protected lean mass and leg power.
Not a weight-loss study. Included to illustrate how rapidly lean tissue can be lost under extreme disuse. Source ↗During controlled overeating, the low-protein group gained 7.0 lb body weight but lost 1.5 lb lean mass. Normal- and high-protein groups gained 6.3 and 7.0 lb lean mass, respectively. Fat gain occurred across groups and did not differ materially by protein intake.
Not a fat-loss trial. It demonstrates that scale weight and lean-tissue response can diverge dramatically depending on diet composition. Source ↗MUSCLE IS MORE THAN APPEARANCE
11 prospective studies • 130,079 adults. The lowest vs. normal lean-mass category was associated with a 30% higher all-cause mortality risk (RR 1.30; 95% CI 1.16–1.47).
PMID 40636391 ↗10 studies. Any resistance training was associated with 15% lower all-cause mortality (RR .85), 19% lower cardiovascular mortality (RR .81), and 14% lower cancer mortality (RR .86). The dose-response analysis found its largest association around 60 min/week.
PMID 35599175 ↗270 randomized trials • 15,827 participants. Dynamic resistance training reduced resting blood pressure by about 4.55/3.04 mmHg; aerobic training by 4.49/2.53; combined training by 6.04/2.54; and isometric training by 8.24/4.00.
PMID 37491419 ↗23 studies • 785 participants. Resistance training improved brachial-artery flow-mediated dilation by 2.39 percentage points (95% CI 1.65–3.14); dynamic resistance training alone improved it by 2.12 points.
PMID 34399984 ↗21 studies • 1,610 adults age 60+. Resistance training improved multiple quality-of-life domains and depression scores. Mean strength improvements included +33.6 lb upper limb, +106.8 lb lower limb, and +3.0 lb handgrip across the pooled analyses.
PMID 35968662 ↗22 randomized studies. Resistance training produced a large pooled effect on muscle strength (ES 0.97; 95% CI .50–1.44) and a significant effect on whole-muscle hypertrophy (ES .30). In adults 80+, the strength effect was ES 1.28.
PMID 32740889 ↗103 older adults • 12 months. Within the progressive resistance-training group, improvement in insulin resistance tracked with increased skeletal muscle (r=−.38) and decreased fat mass (r=.42); changes in HbA1c were related to changes in muscle attenuation.
PMID 23474589 ↗WHAT THE EVIDENCE DOES — AND DOES NOT — SAY
The 31%, 22%, and 3% comparison comes from fat versus fat-free mass. Fat-free mass includes skeletal muscle but also water and other non-fat tissue. Calling it all “muscle” would overstate the measurement.
Longland, Vargas-Molina, Campbell, Antonio, Taylor, Rauch and other trials report conditions in which fat mass decreased while lean or fat-free mass increased.
Older adults, athletes, overweight men, trained women, and people with diabetes do not respond identically. Results demonstrate patterns and possibilities, not guaranteed individual outcomes.
Aerobic training remains a powerful tool for cardiorespiratory fitness. The point is not “weights instead of cardio.” It is that a health-focused fat-loss program should not sacrifice the resistance stimulus that protects muscle and strength.
Prospective cohorts can show that low lean mass or resistance-training participation tracks with mortality risk, but they cannot prove causality the way a randomized intervention can.
A 40% deficit, extreme-volume training, bed rest, or unusually high protein intakes help test mechanisms. They are not presented as the default 12 Week Recomp prescription.
THE PRACTICAL CONCLUSION
Statistics above are rounded from the cited publications for readability. “Lean mass,” “fat-free mass,” and “skeletal muscle” are reported using the terminology of each source and are not treated as interchangeable biological measurements. This page is educational and summarizes population-level research; it is not medical advice or a promise of individual results.